Wilbert Smith Archives Files Box 1136 05 1136-05-p075
Document Text (OCR)
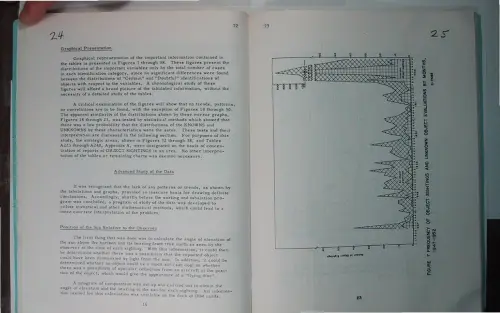
‘Graphical Presentation. Graphical representation of the important information contained in the tables is presented in Figures I through 38, These figures present the distributions of the important variables only by the total number of cases in each identification category, since no significant differences were found between the distributions of "Certain" and "Doubtful" identifications of objects with respect to the variables. A chronological study of these figures will afford a broad picture...